
Purpose
In this tutorial, you will learn to calculate descriptive statistics in jamovi.
This tutorial is based on the free assignment series, “Jamovi Assignments for Introductory Statistics”, by Kimberly A. Barchard, Matthew R Helm, Monica Cordova-Medina, Michal Newhouse, and Jelsy Cadenas Santos, available on the OSF. The data used is real data which was collected by Kimberly Barchard from the student subject pool at the University of Nevada, Las Vegas, in 2002 and 2003.
(License available here)
Background Videos
Before starting this tutorial, watch the following videos to learn about calculating descriptive statistics.
Descriptive Statistics (5 minutes 26 seconds)
Computing means (3 minutes 54 seconds)
Written explanations
If you prefer written explanations of the steps involved, see Section 4 in Learning Statistics with Jamovi.
Set up Jamovi
If you have not yet set up jamovi for the computer you are now using:
Using the website jamovi.org, install jamovi onto your computer. Use the “solid” version that is recommended for most users.
Open jamovi.
In this course, you should report your results to 2 decimal places. Therefore, set the number format so you can see 2 decimal places. To do this,
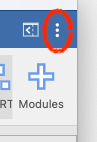
Click the three dots on the top right of the Jamovi screen to change your preferences.
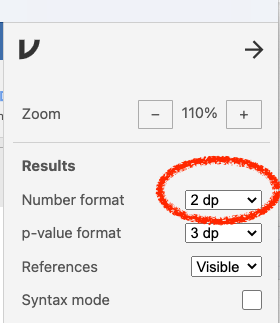
Look at the section for Results.
For Number format, use the drop-down menu to change decimal places to 2 dp.
Data Set
Note: This tutorial uses the original data set, not the recoded one. If you do not have the dataset Original Questionnaire Data.omv already, download it from here.
Open this dataset in jamovi.
Save your jamovi file with a file name that includes your full name and the tutorial name. This will help you find it later when you want to do a similar analysis.
Example: “Betty White PSY 210 Descriptive Statistics in jamovi.omv”
Descriptive Statistics for the Entire Sample
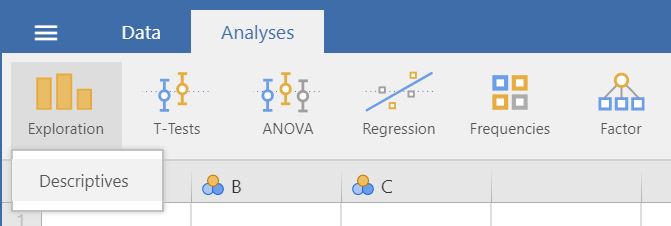
- Under the Exploration menu, click Descriptives.
Calculate descriptive statistics for the variable dogs (“How many dogs do you own?”) and variable cats (“How many cats do you own?”).
Ask it to calculate three statistics that measure Central Tendency: Mean, Median, and Mode.
Ask it to calculate three statistics that measure Dispersion: Standard Deviation, Variance, and Range.
Check your answers
The mean number of dogs owned by all participants is (2dp).
The mean number of cats owned by all participants is (2dp).
For which variable is there more variability?
Descriptive Statistics for Subsamples
Often researchers are interested in particular groups of participants. Here, we will calculate pet ownership for men and women separately.
To create another analysis without erasing the old one, click Exploration, then Descriptives.
Calculate descriptive statistics for the same two variables: dogs and cats. However, this time, split the results by sex.
Calculate the same six statistics as last time: mean, median, mode, standard deviation, variance, and range.
Check your answers
On average, who owns slightly more dogs?
On average, who owns slightly more cats?
Total Correct - your score today!
Save your data
Don’t forget to save your Jamovi file and export it as a PDF, if you like
Optional
Why not try playing with the data visualisation options for both analyses, using the “Plots” menu?
What do these tell you about the data?