Agility course times: A statistical comparison of heights and their speeds
Last updated on
11 min read
Introduction
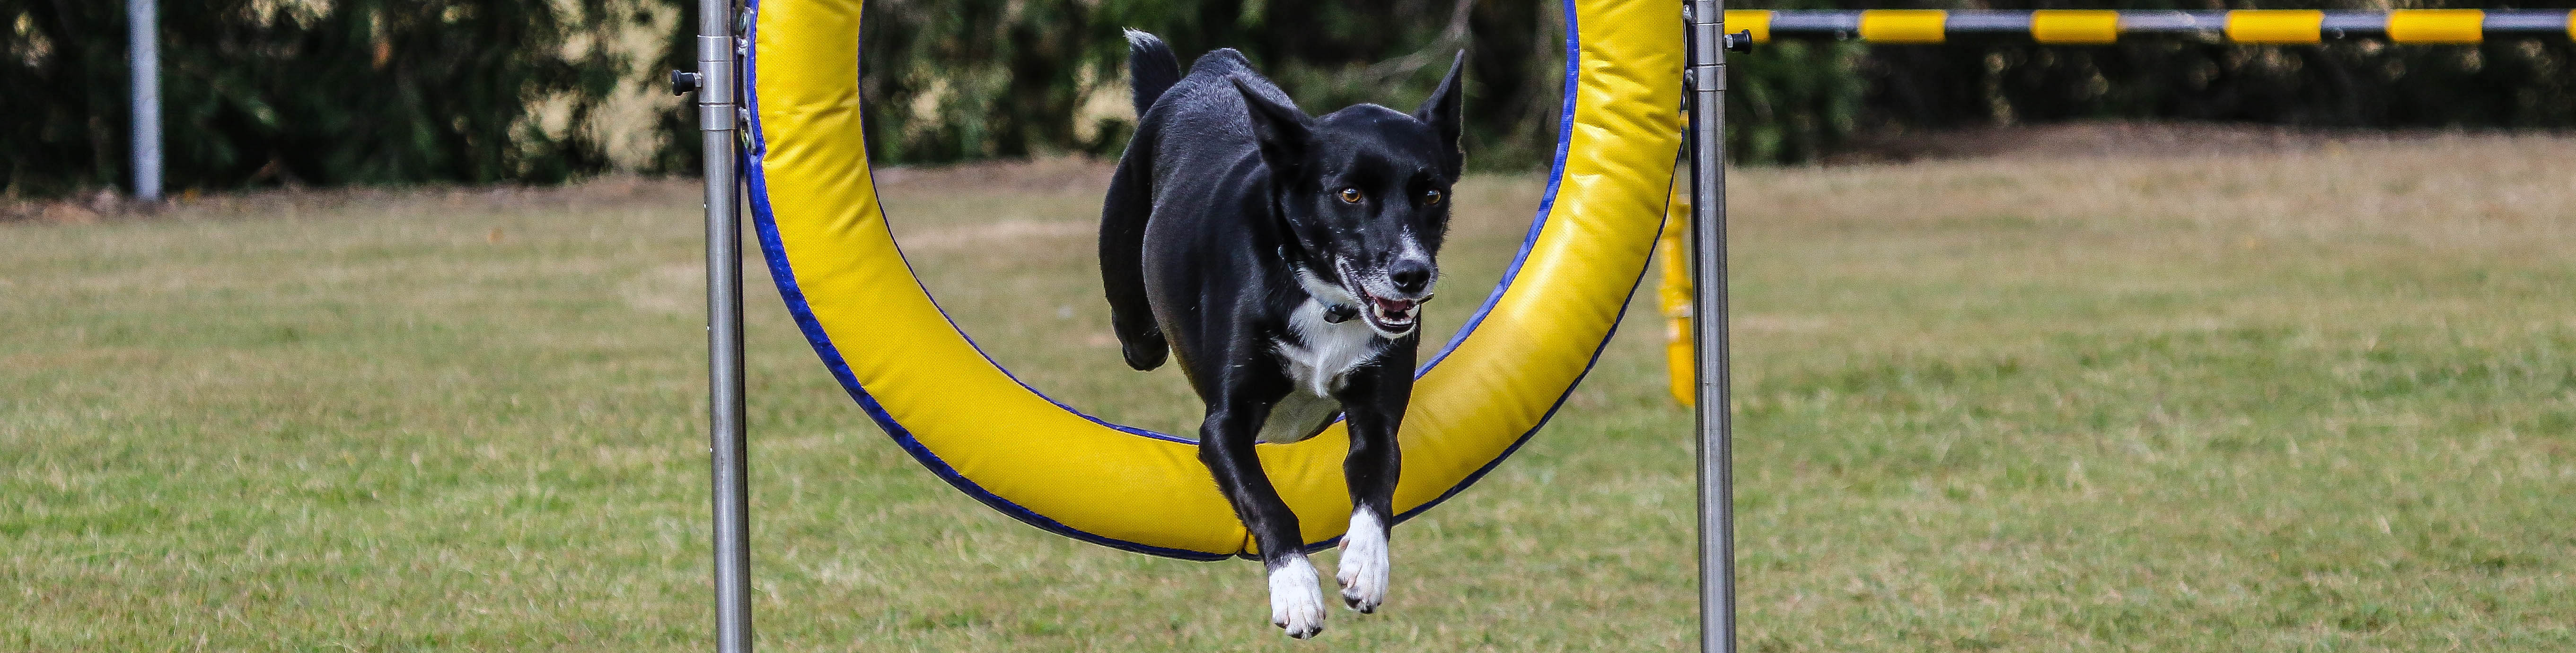
In dog Agility, handlers and dogs compete in a race to get around an obstacle course in the fastest possible time without making any mistakes (knocking bars over, going the wrong way, and so on). It’s pretty fun, but some people take it a bit more seriously than others! Recently, I was sucked into a debate about whether the taller dogs (‘500’ dogs, who are in the height category that encompasses most Border Collies, as well as my own little Kelpie rescue dog Dash) run faster than dogs of other heights (200, 300, 400, and 600). As it turns out, somewhat unsurprisingly, they do. You wouldn’t have really thought you’d need statistics to show that, but some people are hard to persuade, so since I had access to some data on the topic, I wrote an R script to show that.
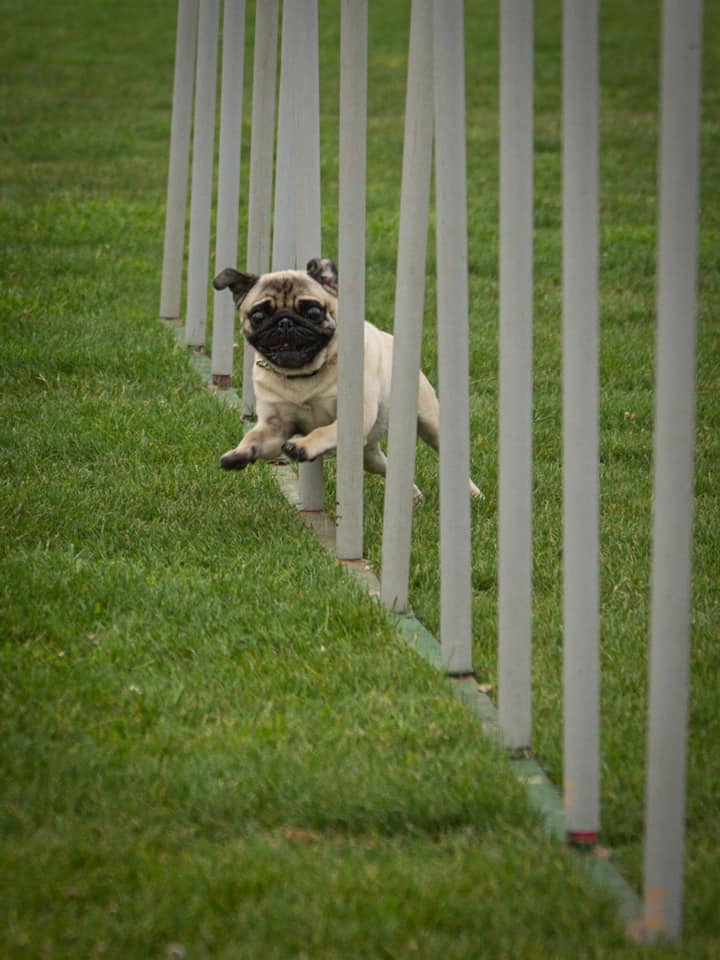
A small dog doing Agility as fast as it can
This analysis is based on data extracted from K9 Entries (https://www.k9entries.com/), for both Victorian and Queensland Agility competitions from 2016 to 2018. Thanks to Alison Muddle for extracting the data and to Judy Kloeden for initial analyses. There are almost 18,000 individual entries in this analysis.
All of the data analyses were conducted in R Statistical Software and compiled using R Markdown in the R Studio package. Note that where there was more than one entry per dog, entries were averaged for the analysis. In addition, speeds faster than 10 m/s and slower than .8 m/s were cropped from the analysis to reduce the effect of outliers. Pairwise comparisons are corrected with the Tukey method, which is fairly conservative.
Results for Novice Agility
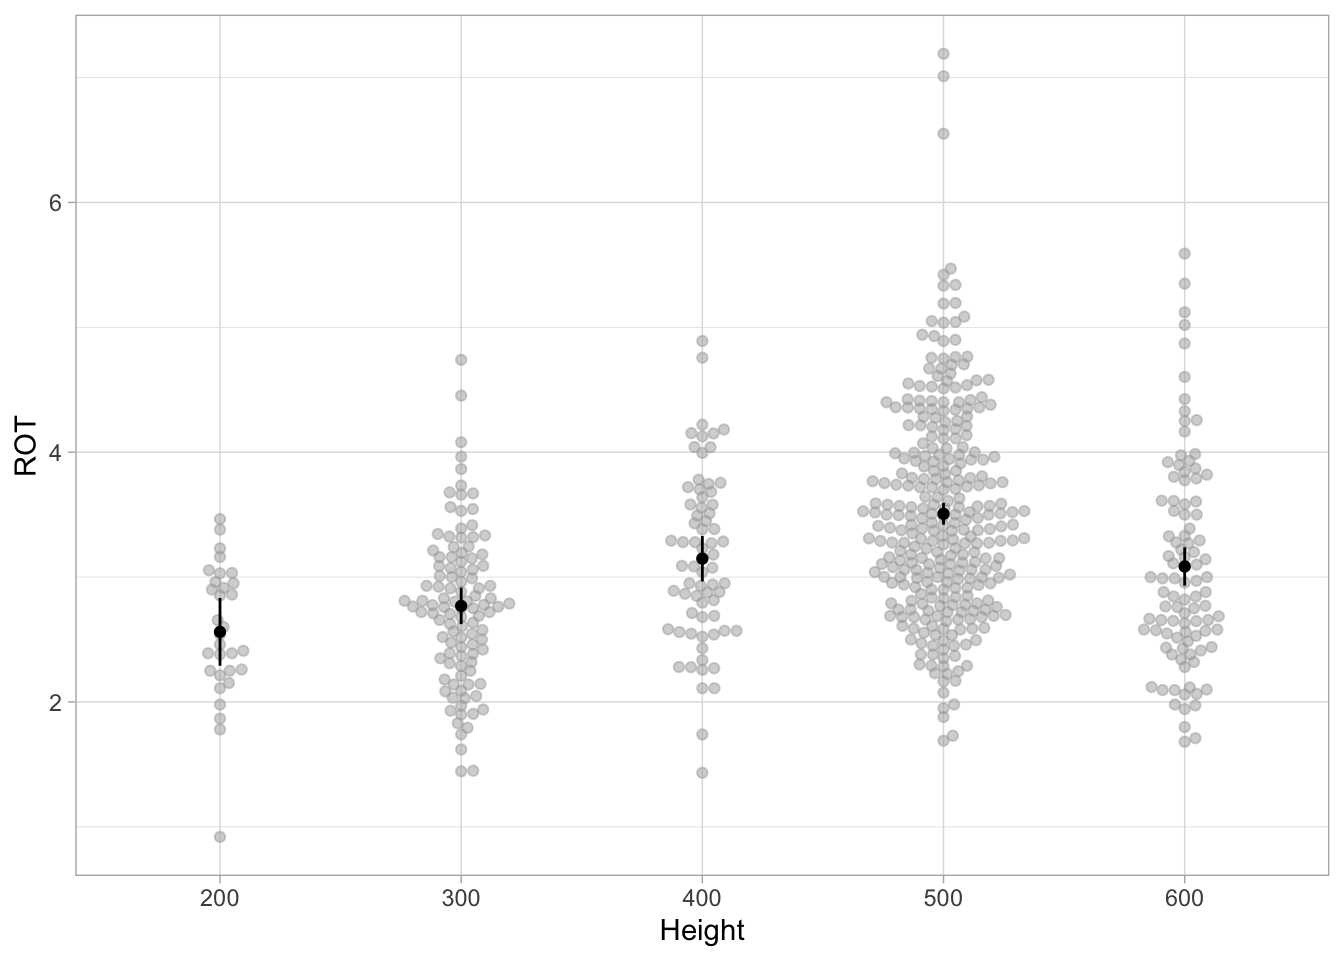
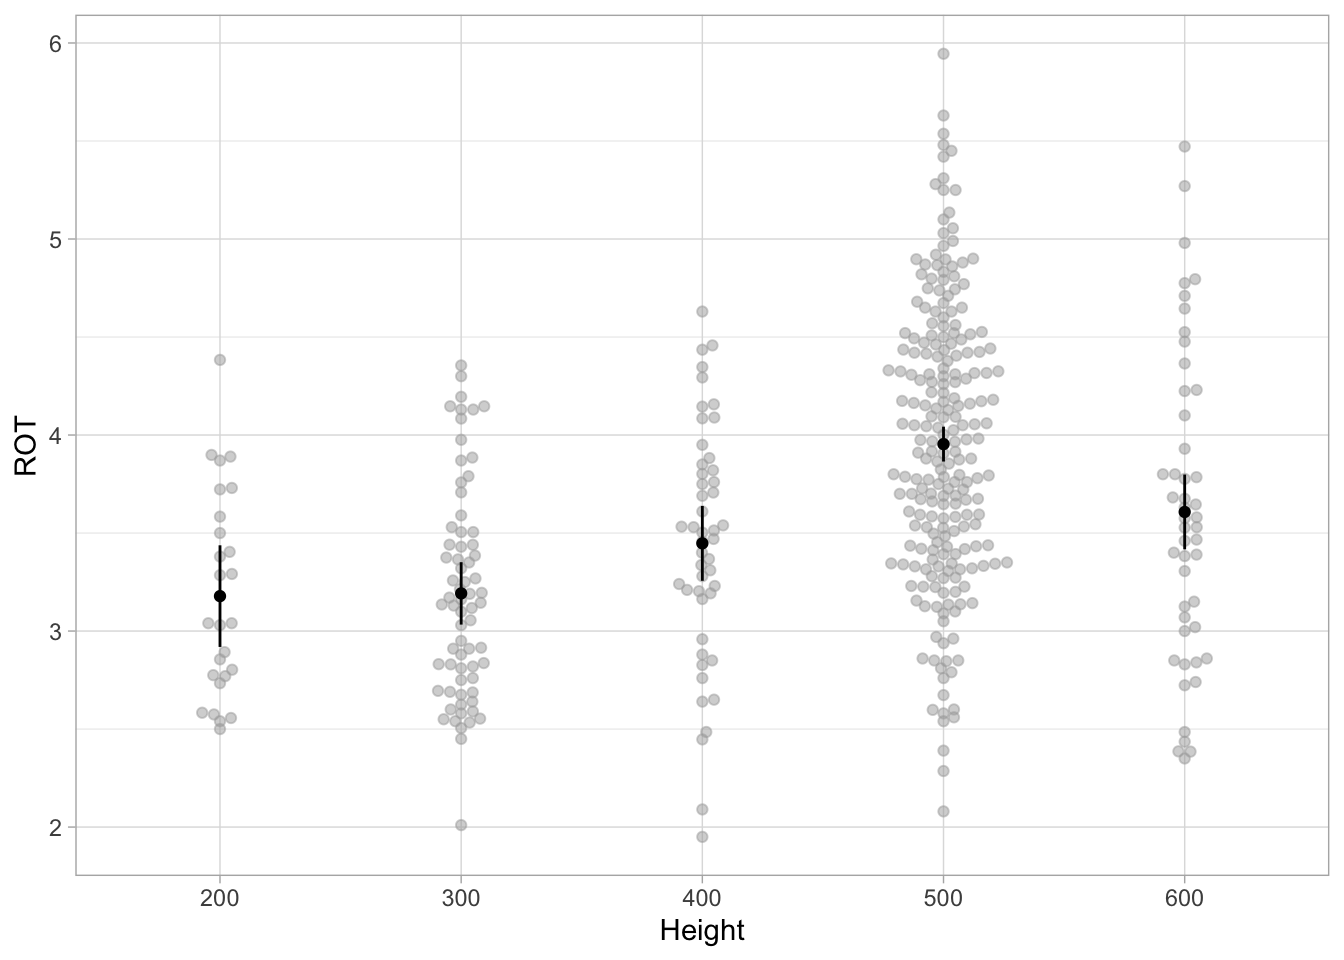
Overall, there was a strongly significant difference between rates of travel for the different heights, F(4, 594) = 25.98, p < .001. The 500 height dogs were significantly faster than all the other heights, all p-values < .01, corrected (see tables below for estimated marginal means and details).
Novice Agility overall statistics
Table 1: Overall results for ROT by height, Novice Agility - ANOVA table
num Df
den Df
MSE
F
ges
Pr(>F)
Height
4
594
0.5922
25.9814
0.1489
0
Novice Agility estimated marginal mean ROTs for each height
Table 2: Estimated marginal means for ROT by height, Novice Agility
Height
emmean
SE
df
lower.CL
upper.CL
200
2.5613
0.1382
594
2.2898
2.8327
300
2.7693
0.0744
594
2.6232
2.9154
400
3.1474
0.0926
594
2.9655
3.3294
500
3.5066
0.0448
594
3.4186
3.5946
600
3.0847
0.0781
594
2.9313
3.2382
Novice Agility pairwise comparisons between ROTs for each height
Table 3: Pairwise comparisons for ROT by height, Novice Agility
contrast
estimate
SE
df
t.ratio
p.value
200 - 300
-0.2081
0.1570
594
-1.3257
0.6753
200 - 400
-0.5862
0.1664
594
-3.5231
0.0042
200 - 500
-0.9453
0.1453
594
-6.5064
0.0000
200 - 600
-0.5235
0.1588
594
-3.2971
0.0091
300 - 400
-0.3781
0.1188
594
-3.1824
0.0133
300 - 500
-0.7373
0.0868
594
-8.4894
0.0000
300 - 600
-0.3154
0.1079
594
-2.9234
0.0295
400 - 500
-0.3591
0.1029
594
-3.4900
0.0047
400 - 600
0.0627
0.1212
594
0.5175
0.9856
500 - 600
0.4219
0.0901
594
4.6837
0.0000
Plot of Novice Agility ROT by height
Results for Excellent Agility
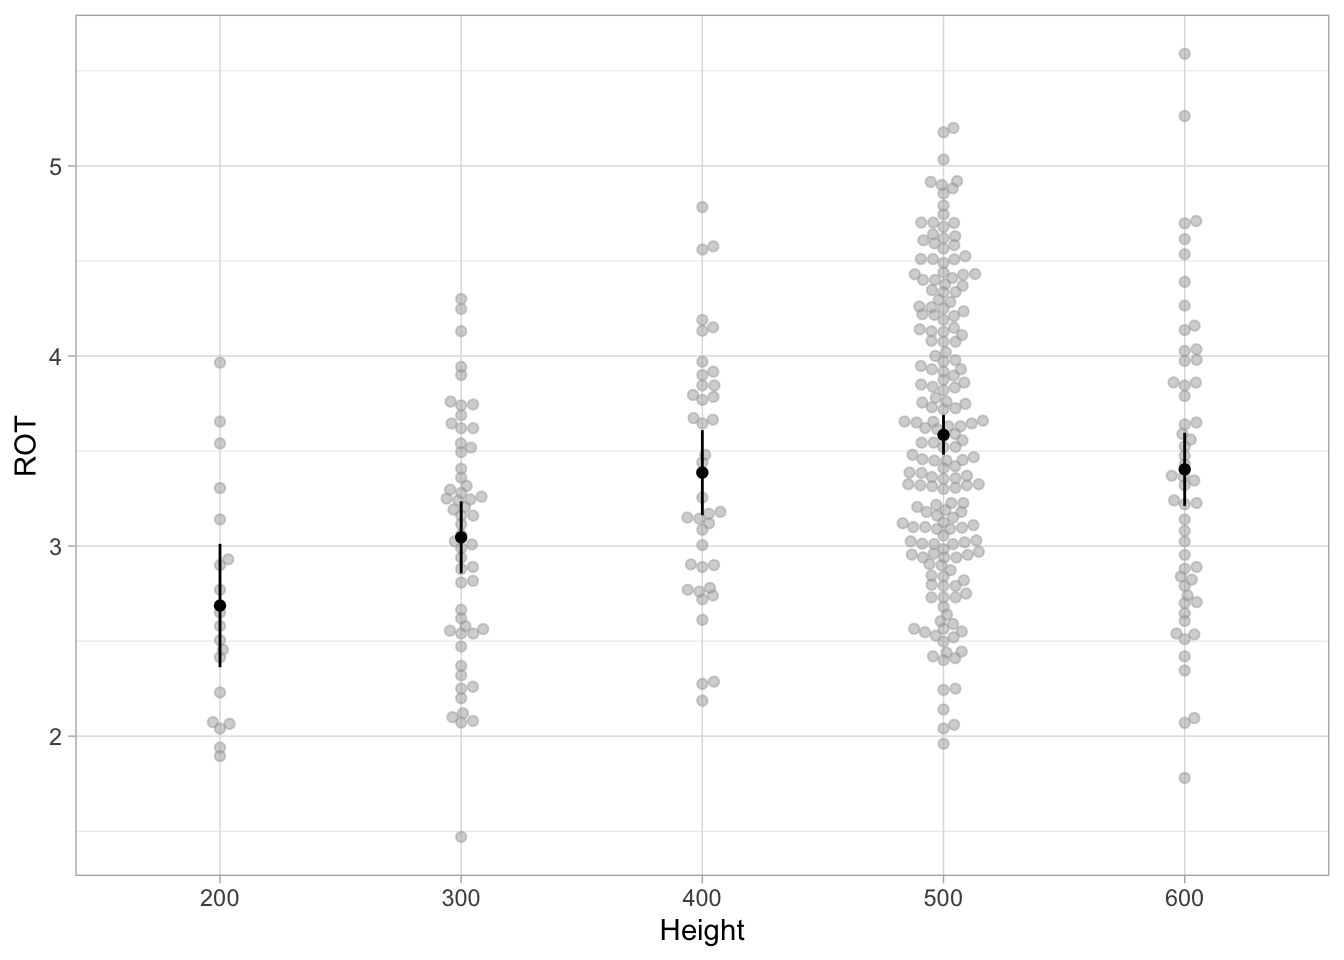
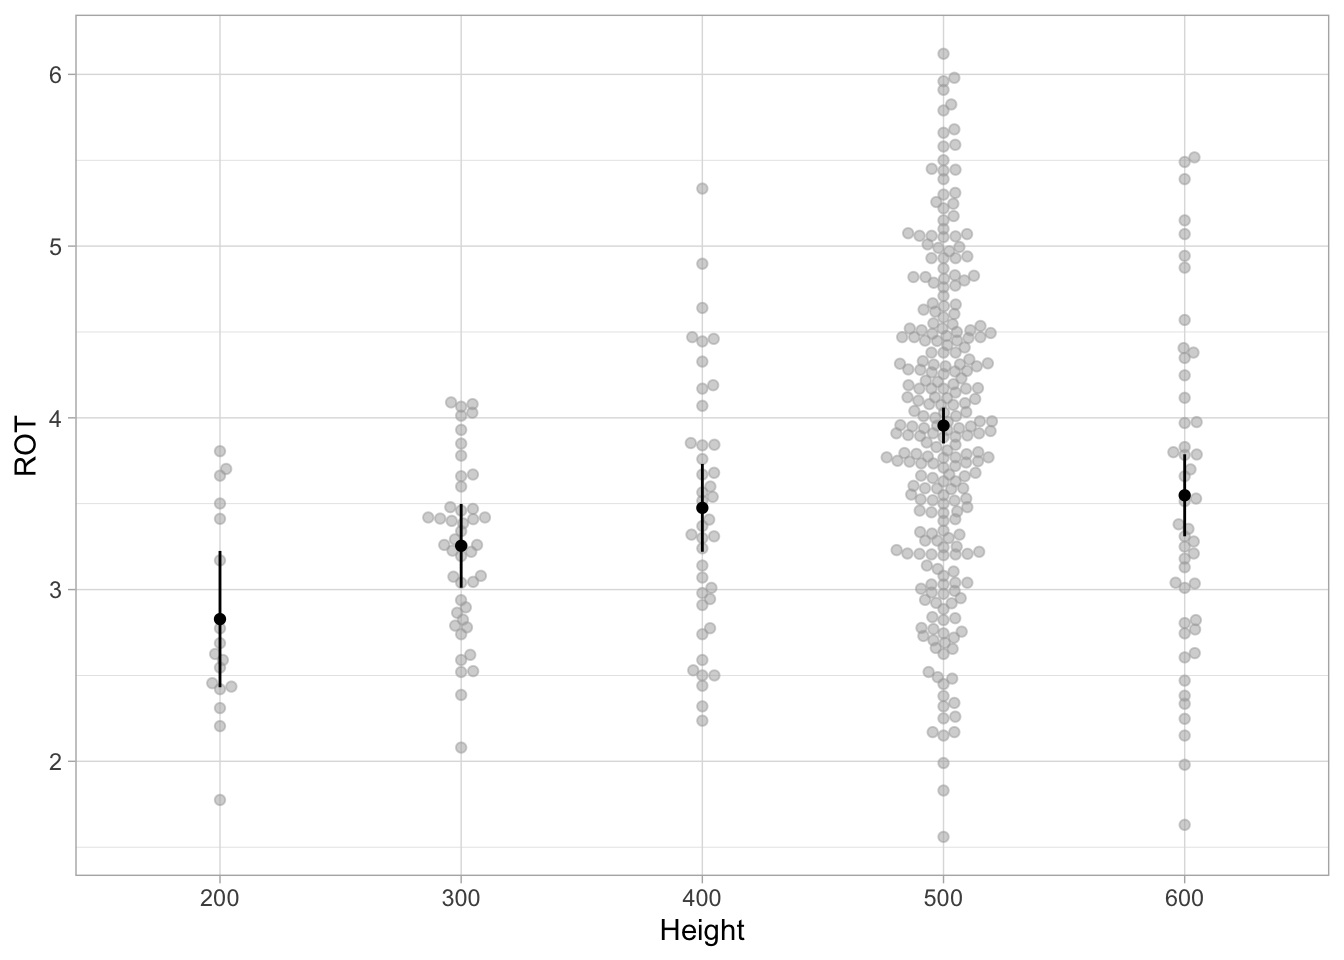
Overall, there was a strongly significant difference between rates of travel for the different heights, F(4,346) = 11.08, p < .001. The 500 height dogs were significantly faster than 300 and 200 but not 400 and 600 dogs, with p-values < .01, corrected (see tables below for estimated marginal means and details).
Table 4: Overall results for ROT by height, Excellent Agility - ANOVA table
num Df
den Df
MSE
F
ges
Pr(>F)
Height
4
346
0.5173
11.0779
0.1135
0
Table 5: Estimated marginal means for ROT by height, Excellent Agility
Height
emmean
SE
df
lower.CL
upper.CL
200
2.6870
0.1650
346
2.3625
3.0115
300
3.0459
0.0961
346
2.8569
3.2350
400
3.3862
0.1137
346
3.1625
3.6099
500
3.5851
0.0533
346
3.4802
3.6899
600
3.4038
0.0979
346
3.2113
3.5963
Table 6: Pairwise comparisons for ROT by height, Excellent Agility
contrast
estimate
SE
df
t.ratio
p.value
200 - 300
-0.3589
0.1909
346
-1.8796
0.3303
200 - 400
-0.6992
0.2004
346
-3.4891
0.0049
200 - 500
-0.8980
0.1734
346
-5.1791
0.0000
200 - 600
-0.7168
0.1918
346
-3.7363
0.0020
300 - 400
-0.3403
0.1489
346
-2.2854
0.1521
300 - 500
-0.5391
0.1099
346
-4.9055
0.0000
300 - 600
-0.3579
0.1372
346
-2.6089
0.0709
400 - 500
-0.1989
0.1256
346
-1.5834
0.5090
400 - 600
-0.0176
0.1500
346
-0.1173
1.0000
500 - 600
0.1813
0.1114
346
1.6265
0.4815
Plot of Excellent Agility ROT by height
Results for Masters Agility
Overall, there was a strongly significant difference between rates of travel for the different heights, F(4,407) =23.43, p < .001. The 500 height dogs were significantly faster than all other heights, with p-values < .001, except for the difference between 500 and 600 (p = .011), corrected (see tables below for estimated marginal means and details).
Table 7: Overall results for ROT by height, Masters Agility - ANOVA table
num Df
den Df
MSE
F
ges
Pr(>F)
Height
4
407
0.4522
23.4262
0.1871
0
Table 8: Estimated marginal means for ROT by height, Masters Agility
Height
emmean
SE
df
lower.CL
upper.CL
200
3.1782
0.1319
407
2.9189
3.4374
300
3.1921
0.0810
407
3.0329
3.3512
400
3.4474
0.0971
407
3.2565
3.6382
500
3.9537
0.0452
407
3.8647
4.0426
600
3.6075
0.0971
407
3.4167
3.7983
Table 9: Pairwise comparisons for ROT by height, Masters Agility
contrast
estimate
SE
df
t.ratio
p.value
200 - 300
-0.0139
0.1547
407
-0.0899
1.0000
200 - 400
-0.2692
0.1637
407
-1.6438
0.4702
200 - 500
-0.7755
0.1394
407
-5.5622
0.0000
200 - 600
-0.4293
0.1637
407
-2.6218
0.0683
300 - 400
-0.2553
0.1264
407
-2.0196
0.2584
300 - 500
-0.7616
0.0927
407
-8.2124
0.0000
300 - 600
-0.4154
0.1264
407
-3.2867
0.0097
400 - 500
-0.5063
0.1071
407
-4.7282
0.0000
400 - 600
-0.1601
0.1373
407
-1.1667
0.7704
500 - 600
0.3462
0.1071
407
3.2327
0.0115
Plot of Masters Agility ROT by height
Results for Open Agility
Overall, there was a strongly significant difference between rates of travel for the different heights, F(4,392) = 14.68, p < .001. The 500 height dogs were significantly faster than all other dogs, with p-values < .01, corrected (see tables below for estimated marginal means and details).
Table 10: Overall results for ROT by height, Open Agility - ANOVA table
num Df
den Df
MSE
F
ges
Pr(>F)
Height
4
392
0.6929
14.6787
0.1303
0
Table 11: Estimated marginal means for ROT by height, Open Agility
Height
emmean
SE
df
lower.CL
upper.CL
200
2.8281
0.2019
392
2.4312
3.2250
300
3.2549
0.1241
392
3.0110
3.4989
400
3.4758
0.1300
392
3.2202
3.7314
500
3.9551
0.0530
392
3.8509
4.0592
600
3.5490
0.1214
392
3.3103
3.7877
Table 12: Pairwise comparisons for ROT by height, Open Agility
contrast
estimate
SE
df
t.ratio
p.value
200 - 300
-0.4268
0.2370
392
-1.8010
0.3744
200 - 400
-0.6477
0.2401
392
-2.6973
0.0561
200 - 500
-1.1270
0.2087
392
-5.3992
0.0000
200 - 600
-0.7209
0.2356
392
-3.0599
0.0199
300 - 400
-0.2209
0.1797
392
-1.2290
0.7344
300 - 500
-0.7002
0.1349
392
-5.1893
0.0000
300 - 600
-0.2941
0.1736
392
-1.6938
0.4389
400 - 500
-0.4793
0.1404
392
-3.4141
0.0063
400 - 600
-0.0732
0.1779
392
-0.4115
0.9940
500 - 600
0.4061
0.1325
392
3.0654
0.0196
Plot of Open Agility ROT by height
Jumping Results
Results for Novice Jumping
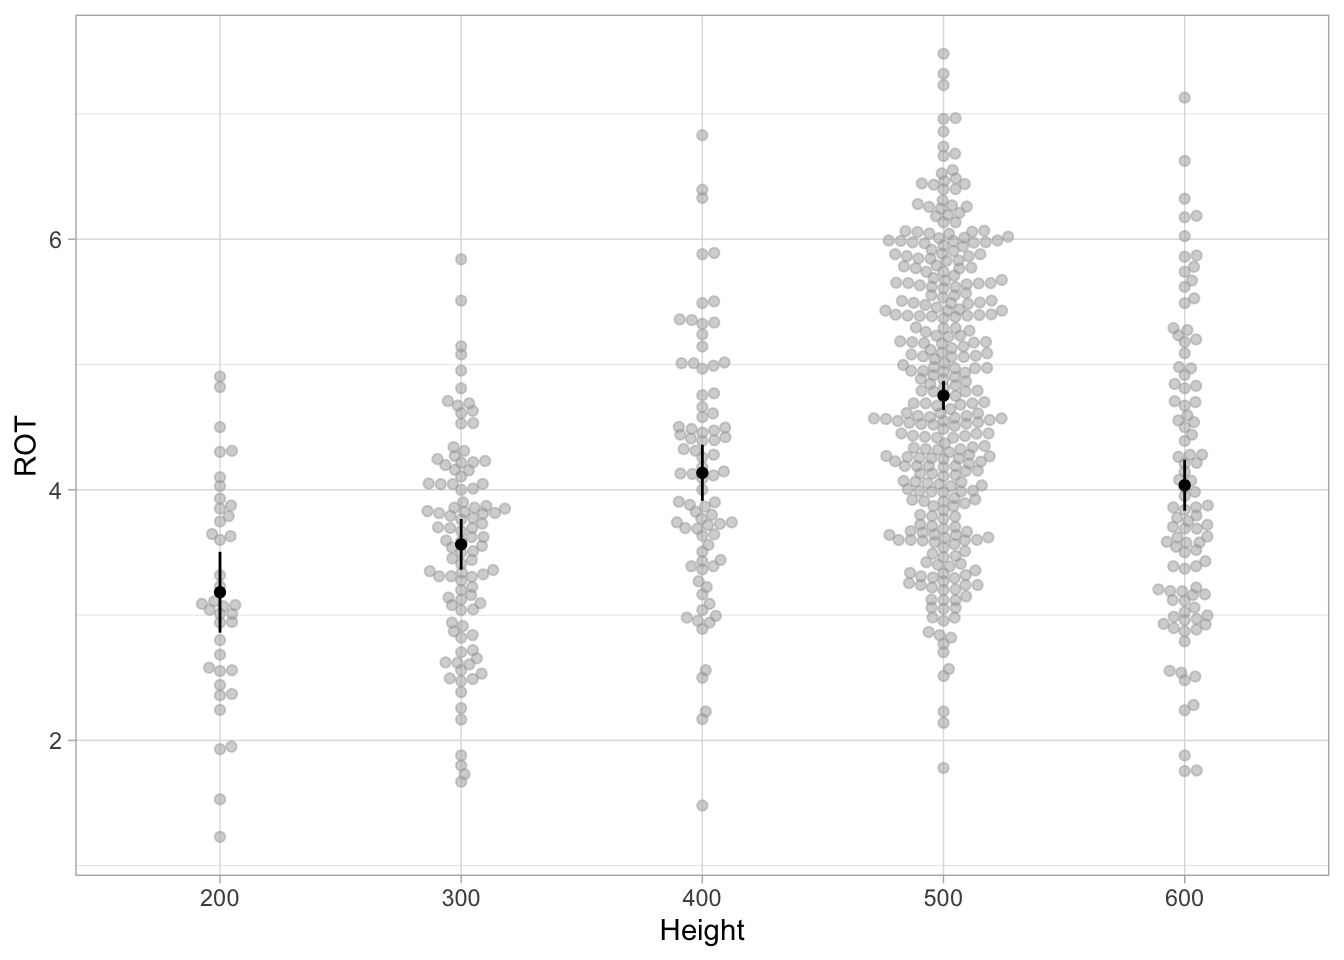
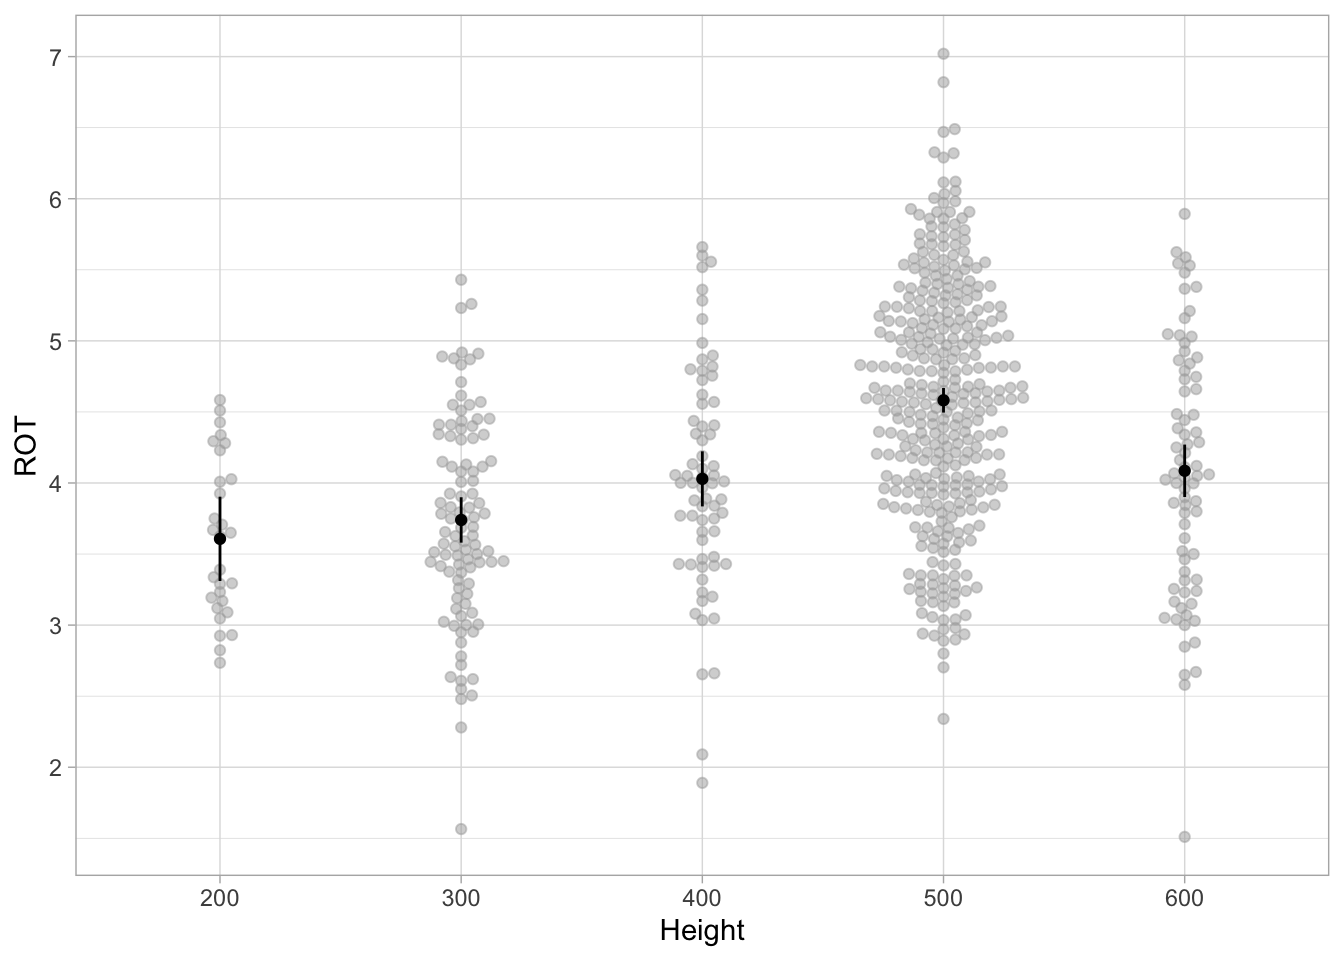
Overall, there was a strongly significant difference between rates of travel for the different heights, F(4,619) = 41.16, p < .001. The 500 height dogs were significantly faster than all the other heights, all p-values < .001, corrected (see tables below for estimated marginal means and details).
Table 13: Overall results for ROT by height, Novice Jumping - ANOVA table
num Df
den Df
MSE
F
ges
Pr(>F)
Height
4
619
1.0544
41.1608
0.2101
0
Table 14: Estimated marginal means for ROT by height, Novice Jumping
Height
emmean
SE
df
lower.CL
upper.CL
200
3.1824
0.1644
619
2.8595
3.5053
300
3.5644
0.1032
619
3.3617
3.7671
400
4.1355
0.1141
619
3.9115
4.3596
500
4.7522
0.0586
619
4.6371
4.8673
600
4.0367
0.1037
619
3.8330
4.2404
Table 15: Pairwise comparisons for ROT by height, Novice Jumping
contrast
estimate
SE
df
t.ratio
p.value
200 - 300
-0.3820
0.1941
619
-1.9675
0.2832
200 - 400
-0.9531
0.2001
619
-4.7623
0.0000
200 - 500
-1.5698
0.1746
619
-8.9929
0.0000
200 - 600
-0.8543
0.1944
619
-4.3942
0.0001
300 - 400
-0.5712
0.1538
619
-3.7125
0.0021
300 - 500
-1.1878
0.1187
619
-10.0087
0.0000
300 - 600
-0.4723
0.1463
619
-3.2280
0.0114
400 - 500
-0.6167
0.1283
619
-4.8079
0.0000
400 - 600
0.0988
0.1542
619
0.6409
0.9683
500 - 600
0.7155
0.1191
619
6.0057
0.0000
Plot of Novice Jumping ROT by height
Results for Excellent Jumping
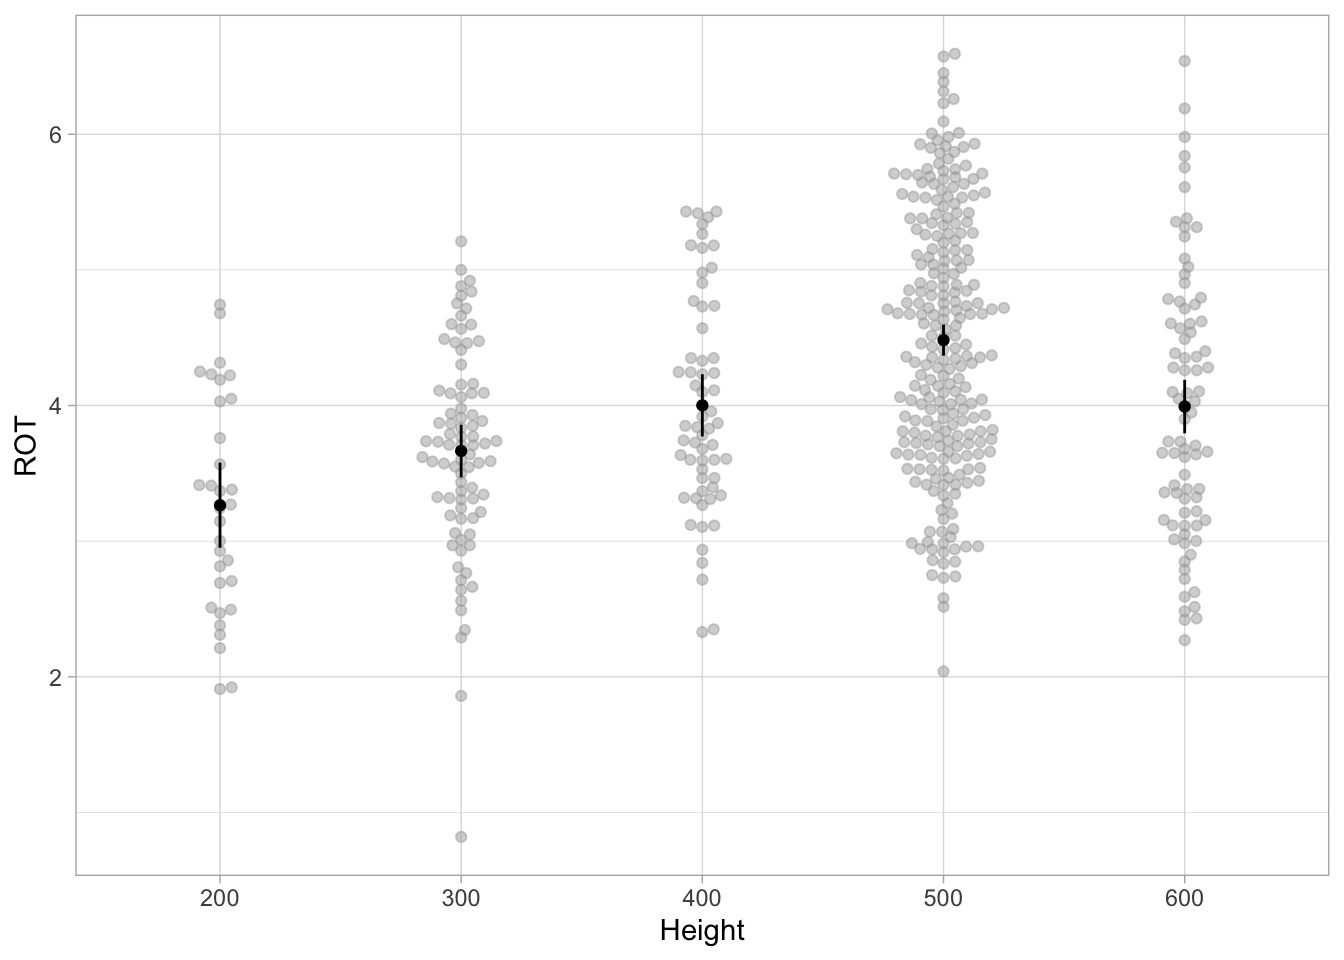
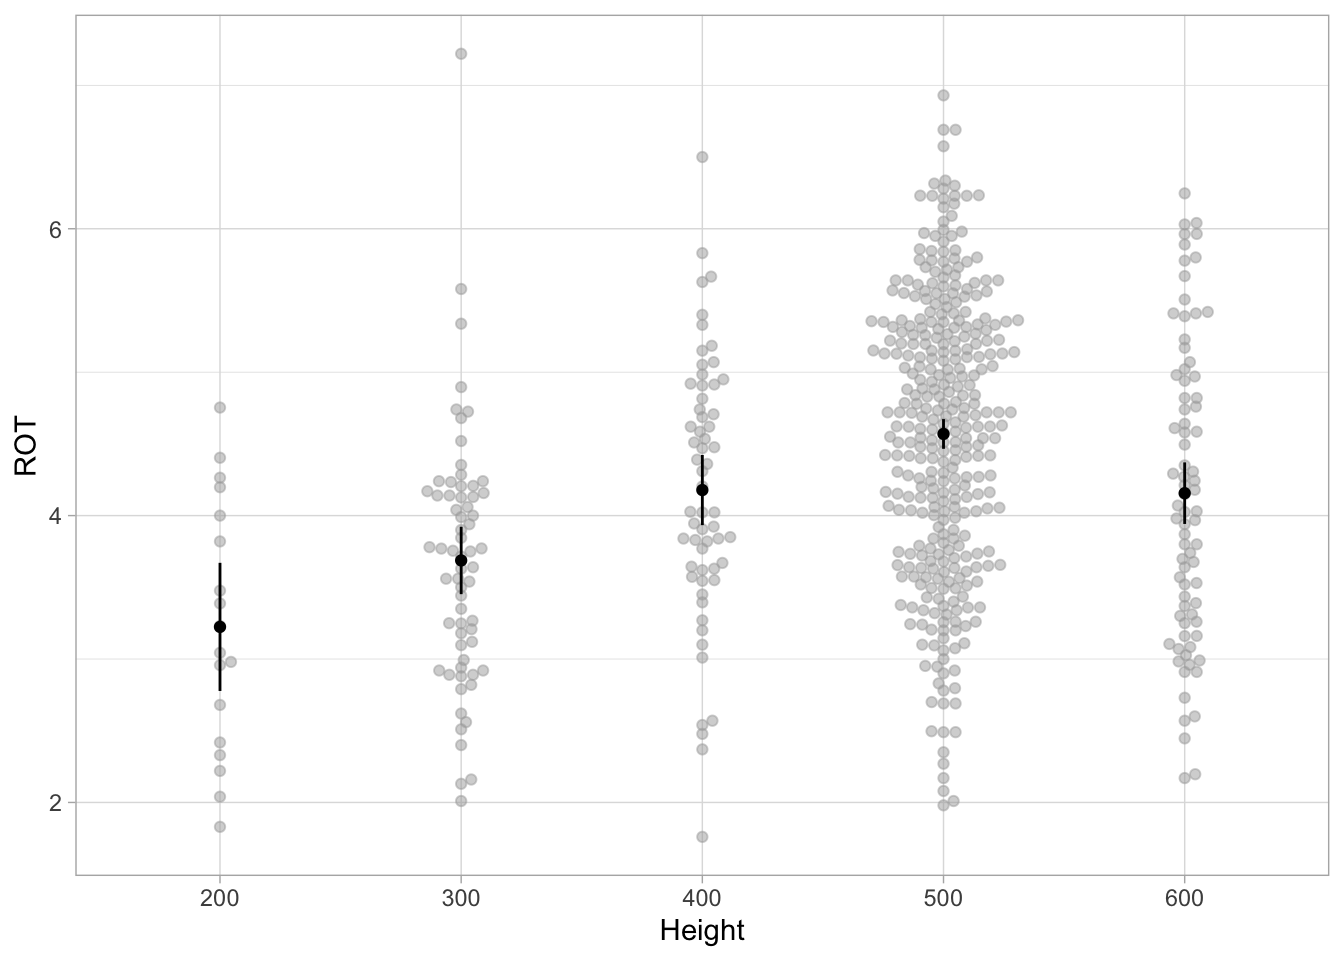
Overall, there was a strongly significant difference between rates of travel for the different heights, F(4,495) = 22.87, p < .001. The 500 height dogs were significantly faster than all other dogs, with p-values < .01, corrected (see tables below for estimated marginal means and details).
Table 16: Overall results for ROT by height, Excellent Jumping - ANOVA table
num Df
den Df
MSE
F
ges
Pr(>F)
Height
4
495
0.8172
22.8652
0.156
0
Table 17: Estimated marginal means for ROT by height, Excellent Jumping
Height
emmean
SE
df
lower.CL
upper.CL
200
3.2651
0.1598
495
2.9511
3.5790
300
3.6653
0.0986
495
3.4715
3.8591
400
4.0013
0.1167
495
3.7721
4.2306
500
4.4821
0.0580
495
4.3682
4.5960
600
3.9922
0.1004
495
3.7948
4.1895
Table 18: Pairwise comparisons for ROT by height, Excellent Jumping
contrast
estimate
SE
df
t.ratio
p.value
200 - 300
-0.4002
0.1878
495
-2.1314
0.2084
200 - 400
-0.7363
0.1979
495
-3.7209
0.0021
200 - 500
-1.2171
0.1700
495
-7.1592
0.0000
200 - 600
-0.7271
0.1887
495
-3.8523
0.0012
300 - 400
-0.3360
0.1528
495
-2.1993
0.1816
300 - 500
-0.8168
0.1144
495
-7.1389
0.0000
300 - 600
-0.3269
0.1408
495
-2.3219
0.1396
400 - 500
-0.4808
0.1303
495
-3.6892
0.0023
400 - 600
0.0092
0.1540
495
0.0597
1.0000
500 - 600
0.4900
0.1160
495
4.2244
0.0003
Plot of Excellent Jumping ROT by height
Results for Masters Jumping
Overall, there was a strongly significant difference between rates of travel for the different heights, F(4,608) = 30.42, p < .001. The 500 height dogs were significantly faster than all other heights, with p-values < .001, corrected (see tables below for estimated marginal means and details).
Table 19: Overall results for ROT by height, Masters Jumping - ANOVA table
num Df
den Df
MSE
F
ges
Pr(>F)
Height
4
608
0.6615
30.4158
0.1667
0
Table 20: Estimated marginal means for ROT by height, Masters Jumping
Height
emmean
SE
df
lower.CL
upper.CL
200
3.1782
0.1319
407
2.9189
3.4374
300
3.1921
0.0810
407
3.0329
3.3512
400
3.4474
0.0971
407
3.2565
3.6382
500
3.9537
0.0452
407
3.8647
4.0426
600
3.6075
0.0971
407
3.4167
3.7983
Table 21: Pairwise comparisons for ROT by height, Masters Jumping
contrast
estimate
SE
df
t.ratio
p.value
200 - 300
-0.1329
0.1715
608
-0.7746
0.9379
200 - 400
-0.4219
0.1804
608
-2.3392
0.1340
200 - 500
-0.9748
0.1573
608
-6.1964
0.0000
200 - 600
-0.4788
0.1778
608
-2.6923
0.0562
300 - 400
-0.2891
0.1278
608
-2.2613
0.1591
300 - 500
-0.8419
0.0925
608
-9.1030
0.0000
300 - 600
-0.3459
0.1242
608
-2.7846
0.0437
400 - 500
-0.5529
0.1080
608
-5.1184
0.0000
400 - 600
-0.0569
0.1362
608
-0.4176
0.9936
500 - 600
0.4960
0.1037
608
4.7817
0.0000
Plot of Masters Jumping ROT by height
Results for Open Jumping
Overall, there was a strongly significant difference between rates of travel for the different heights, F(4,552) = 19.28, p < .001. The 500 height dogs were significantly faster than all other dogs, with p-values < .001, corrected, for 200 and 300 dogs, p = .032 for 400 dogs and p = .006 for 600 dogs (see tables below for estimated marginal means and details).
Table 22: Overall results for ROT by height, Open Jumping - ANOVA table
num Df
den Df
MSE
F
ges
Pr(>F)
Height
4
552
0.9311
19.2803
0.1226
0
Table 23: Estimated marginal means for ROT by height, Open Jumping
Height
emmean
SE
df
lower.CL
upper.CL
200
3.2240
0.2274
552
2.7772
3.6708
300
3.6872
0.1197
552
3.4521
3.9223
400
4.1781
0.1246
552
3.9334
4.4228
500
4.5692
0.0526
552
4.4658
4.6726
600
4.1564
0.1093
552
3.9418
4.3710
Table 24: Pairwise comparisons for ROT by height, Open Jumping
Comments?
{{ template "_internal/disqus.html" . }}