Writing Reproducible Manuscripts in R Markdown
Writing Reproducible Manuscripts in R Markdown
- Lecturer, School of Psychology and Behavioural Science, UNE
- Adjunct Senior Lecturer, Research School of Psychology, ANU
What is R Markdown?
- Just a simple markdown language to help you write things incorporating R code
- Can use it for all sorts of things!
- I have used it (in chronologial order) to:
- Make results easy to send to collaborators
- Make results more replicable for others to see
- Write whole manuscripts using papja
- Make my own website!
What do you need?
- R Studio is easiest
- File > New File > R Markdown…
- To knit to PDF, you’ll need a $\TeX$ install too
- Sometimes I use kableextra to make nicer tables
Typical header:
library("papaja")
library(readxl)
library("yarrr") # Load the package!

require(afex) # uses package to perform RM ANOVAs.
SPQ_for_R <- read_excel("SPQ_for_R.xlsx")
Area <- read.csv("Overall_Area_for_R.csv")
Path <- read.csv("Overall_Path_for_R.csv")
The papaja package
- Still in development, so not on CRAN yet
- Need to have devtools installed to download it
Documentation here
# Install devtools package if necessary
if(!"devtools" %in% rownames(installed.packages()))
install.packages("devtools")

# Install the stable development verions from GitHub
devtools::install_github("crsh/papaja")
Citations
- You can use BibTeX for citations
- Pretty easy if your MS was already in LaTeX
- If not, it’s not really that different to other ref managers
- Just use “@” as your citation key instead of $\cite$
Example manuscript fragment:
Since its earliest conceptualization, schizophrenia has been
associated with motor anomalies [@Bleuler:1911ko;
@Kraepelin:1913vl]....
Including plots
Include something you already made:
knitr::include_graphics('ExampleEllipse.png')Generate a plot from scratch:
pirateplot(formula = SPQ ~ Group,
       data = SPQ_for_R,
       xlab = "Group", #x label
       ylab = "SPQ total score", # ylabel,
       par(tcl=.2),
       cex.axis = .85,
       theme = 2, # inbuilt theme
       pal = "google")
fig.cap = "(ref:SPQ)"
Result:
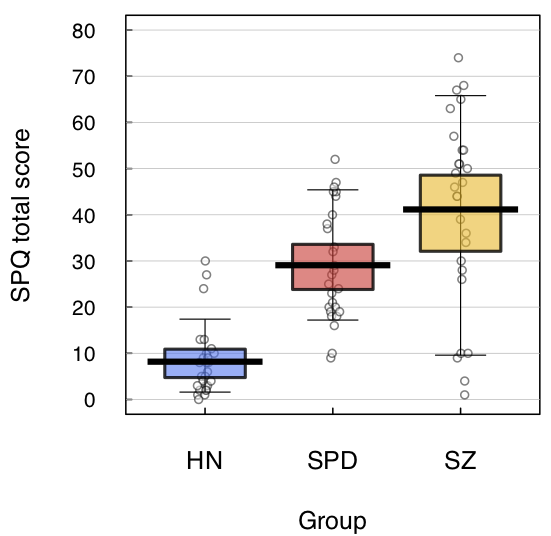
Scores on the SPQ for the groups
You can include $\LaTeX$ code for math:
$PL = \sum_{n-1}^{N} \sqrt{[x(n) - x(n-1)]^2+[y(n) - y(n-1)]^2}$
- How it comes out:
$$ PL = \sum_{n-1}^{N} \sqrt{[x(n) - x(n-1)]^2+[y(n) - y(n-1)]^2} $$
Tables: You can include LaTeX tables if you like:
\begin{table}%[tbhp]
\centering
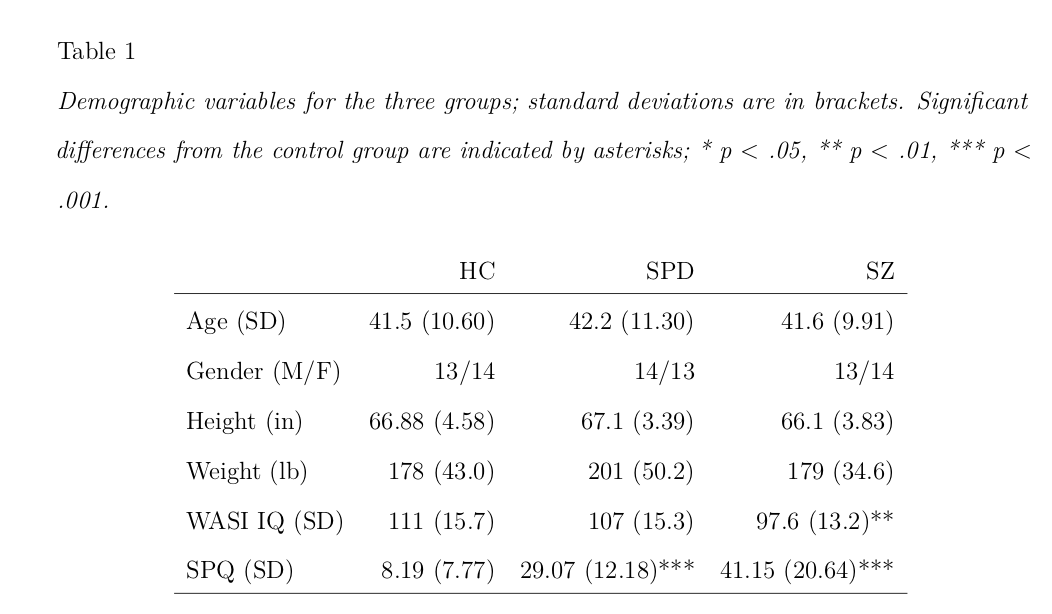
\caption{Demographic variables for the three groups.}
\begin{tabular}{lrrr}
& HC & SPD & SZ \\
\hline
Age (SD) & 41.5 (10.60) & 42.2 (11.30) & 41.6 (9.91)\\
Gender (M/F) & 13/14 & 14/13 & 13/14 \\
Height (in) & 66.88 (4.58) & 67.1 (3.39) & 66.1 (3.83)\\
Weight (lb) & 178 (43.0) & 201 (50.2) & 179 (34.6)\\
WASI IQ (SD) & 111 (15.7) & 107 (15.3) & 97.6 (13.2)** \\
SPQ (SD) & 8.19 (7.77) & 29.07 (12.18)*** & 41.15 (20.64)***\\
\hline
\end{tabular}
\label{Table:Demographics}
\end{table}
How it comes out:
APA Style tables!
- First, you need to analyse the results
- You can do that right in the manuscript using normal r code!
You already loaded the data at the top of the manuscript
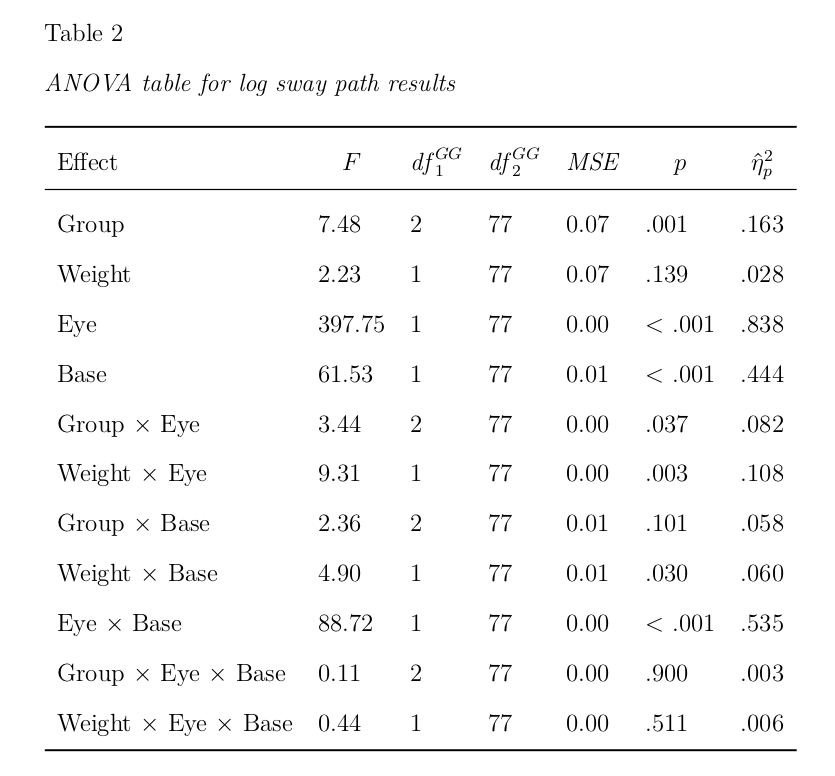
analysis_Path <- aov_ez("Sub", "log_Data", Path,
                     within=c("Eye","Base"),
                     between= c("Group"),
                     factorize = FALSE)

Path_results <- apa_print(analysis_Path, es = "pes")
APA Style tables!
Now you just need to tell RMarkdown to print the table!
table_SwayPath <- Path_results$table
apa_table(table_SwayPath,
caption = 'ANOVA table for log sway path results')
How it comes out:
Best bit: Report the results!
- When you did the analysis earlier, you made all the results you need!
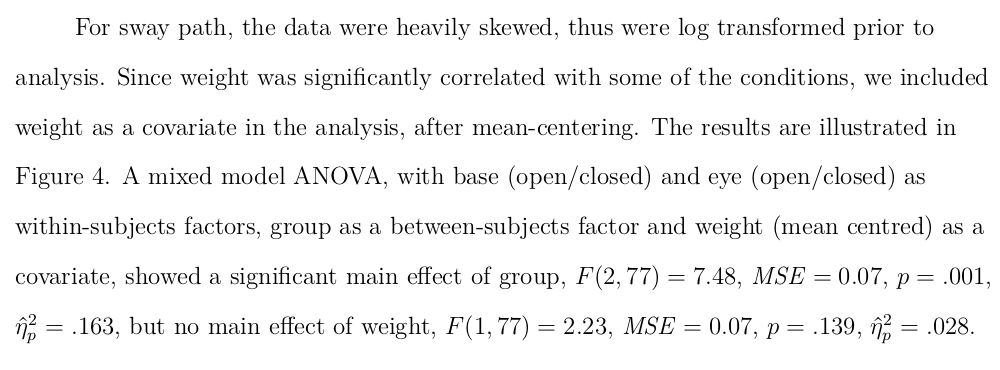
Papaja lets you just report those right in the text.
A mixed model ANOVA, with base (open/closed) and eye
(open/closed) as within-subjects factors,and group
as a between-subjects factor, showed a significant
main effect of group, `r Path_results$full$Group`.
How it comes out:
Referring to figures and tables in text
You can refer to the figures and tables using \@ref:
The results are illustrated in Figure \@ref(fig:plotPath)Make sure your figure is called exactly that
{r plotPath, echo = FALSE,
fig.cap = "\\label{fig:plotPath},
Results for sway path (log transformed to correct skew)
for all participants. Means are shown by black
horizontal bars."}
Knitting the document
- To render the document into a lovely PDF, just click the “knit” button at the top of the document
- If you get an error message, you can usually just google it.
- Common traps: Package not installed
- Weird characters in BibTeX file
- Issues with cutting and pasting from Word (e.g. quotation marks, symbols)
- Can also knit to Word! (For the Luddites you collaborate with)
What else can I do with R Markdown?
- I’m glad you asked!
- I’ve just been using Hugo Academic to make a website!
- Documentation here
- My website here (still in beta!)
- I made these slides with Hugo too
Awesome guide from Dan Quintana
If you’re an academic you need a website so that people can easily find info about your research and publications. Here’s how to make your own website for free in around an hour using the blogdown package in #Rstats [UPDATED 2019 THREAD] pic.twitter.com/YhHkEWlemW
— Dan Quintana (@dsquintana) June 15, 2019